What is Observability? Not Just Logs, Metrics and Traces


Audio : Listen to This Blog.
The complexity and scale of dynamic systems put increasing pressure on IT teams to monitor and address problems within multi-cloud environments. DevOps and SRE teams seek better visibility into increasingly complex computing systems and infrastructure. What is the significance of observable data? Tell me the importance of this technology in your business strategy? In IT and cloud computing, observability means measuring systems and their current states using data generated, like logs, metrics, and traces.
The Foundation of Observability
At its core, observability represents a paradigm shift in understanding and managing complex systems. Unlike traditional monitoring, which focuses solely on assessing whether a system is functioning within predefined parameters, observability seeks to illuminate the inner workings of a system by analyzing its external outputs. By harnessing data from metrics, logs, traces, and events, observability goes beyond surface-level indicators to provide a holistic view of system behavior.
Observability transcends the limitations of traditional monitoring by offering insights into not just the ‘what’ but also the ‘why’ and ‘how’ of system behavior. It enables engineers to better understand system interactions, dependencies, and emergent behaviors, especially during complex and unpredictable scenarios. This comprehensive view empowers organizations to identify and address issues proactively, optimize system performance, and enhance reliability and resilience.
Monitoring vs. Observability: What’s the Difference Between Monitoring and Observability?
Is observation a good idea? I guess not. Observability and monitoring are related but different concepts. While monitoring primarily focuses on collecting and displaying data about a system’s health and performance, observability extends this paradigm by incorporating additional layers of depth and context. Monitoring typically involves tracking predefined metrics and KPIs to assess the state of a system in real time. This approach provides valuable insights into the overall health and performance of the system, allowing for proactive identification of issues and trends.

Source: Middleware
Understanding System Behavior at a Deeper Level
In contrast, observability delves deeper into understanding system behavior’s underlying causes and implications. It goes beyond surface-level metrics and encompasses a holistic view of the system’s internal state, including its interactions, dependencies, and emergent behaviors. Observability aims to answer the ‘what’ – i.e., what is happening within the system – and the ‘why’ and ‘how’ – why certain events occur and propagate through the system.
Flexible and Adaptive Data Collection Approach
One of the critical distinctions between observability and monitoring lies in their respective analysis approaches. While monitoring typically relies on predefined metrics and thresholds, observability adopts a more flexible and adaptive approach. It embraces a broader range of data sources, including metrics, logs, traces, and events, to comprehensively view system behavior.
Emphasis on Context and Causality
Moreover, observability emphasizes context and causality, seeking to uncover the symptoms of an issue and its underlying mechanisms. By correlating data from disparate sources and tracing the flow of events across distributed systems, observability enables engineers to gain a deeper understanding of system behavior and identify subtle patterns and anomalies that may indicate potential issues or opportunities for optimization.
The Key Components of Observability: Telemetry Types and the Core Analysis Loop
Observability involves collecting and comparing information sources to better understand a system’s behavior. This is done through the core analysis loop, where analysis and optimization are continuously triggered, allowing teams to monitor problems and optimize system performance efficiently. Observability tools collect data from varying components of the system, including logs and metric data traces, to get a better picture of the software system.
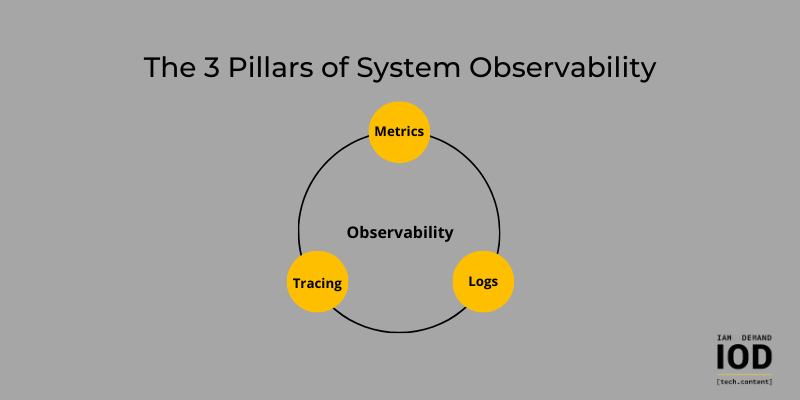
Source: IOD
Metrics
Metrics form the bedrock of observability, offering quantitative data about various aspects of a system, such as response times, error rates, and throughput. Performance metrics provide insights into the efficiency and responsiveness of a system, allowing engineers to identify performance bottlenecks and optimize resource allocation. Resource utilization metrics, on the other hand, shed light on the usage patterns of system resources, including CPU, memory, and disk space, enabling proactive capacity planning and resource optimization strategies.
Logs
Logs are crucial in observability by providing a detailed narrative of system events, including errors, warnings, and informational messages. They offer context to metrics by capturing the events leading up to an issue, providing valuable insights into the ‘how’ and ‘why’ behind system behavior. During troubleshooting, logs serve as a vital tool for root cause analysis, allowing engineers to trace the execution path of a request, identify strange behaviors, and pinpoint the underlying causes of issues.

With the advent of centralized logging platforms and log management solutions, organizations can aggregate and analyze logs from across their infrastructure, facilitating efficient log search, correlation, and analysis and enabling proactive detection and resolution of issues.
Traces
Traces, or distributed traces, provide visibility into the flow of a request as it traverses various components of a distributed system. Tracing allows for reconstructing a transaction’s journey across multiple services and infrastructure layers, from initiation to completion. By capturing timing information and contextual metadata at each step of the request’s path, traces enable engineers to identify bottlenecks, latency issues, and other abnormalities across the entire system. Distributed tracing systems, such as Jaeger and Zipkin, facilitate the collection, aggregation, and visualization of trace data, empowering organizations to gain insights into the end-to-end performance of their distributed systems.
The Significance of Observability
Rapid Troubleshooting
Observability equips engineering teams with the tools to identify and resolve issues swiftly. Correlating metrics, logs, and traces offer a holistic view of system health, enabling quicker root cause analysis and issue resolution. Advanced anomaly detection algorithms leverage machine learning techniques to automatically identify abnormal patterns and deviations from expected behavior, enabling teams to promptly prioritize and address critical issues.
Improved Decision-Making
Informed decision-making relies on a comprehensive understanding of system behavior. Observability empowers teams to make data-driven decisions by providing real-time insights into performance, user interactions, and overall system health. Advanced analytics capabilities, such as predictive modeling and trend analysis, enable teams to forecast future system behavior based on historical data trends, facilitating proactive decision-making and resource allocation.

Furthermore, observability platforms often offer customizable dashboards and reporting tools, allowing stakeholders to visualize critical metrics and KPIs in real time and facilitating informed decision-making at all levels of the organization.
Proactive System Optimization
Observability is not just reactive; it’s a proactive approach to system management. By continuously analyzing metrics, logs, and traces, teams can identify potential bottlenecks or performance degradation before they escalate, allowing for preemptive optimization. Advanced anomaly detection algorithms and predictive analytics techniques enable teams to anticipate future resource demands and adjust infrastructure configurations accordingly, optimizing performance and scalability.
Additionally, observability platforms often provide automated remediation capabilities, allowing teams to implement proactive optimization strategies, such as auto-scaling and workload rebalancing, in response to detected anomalies or performance degradation.
Implementing Observability
Discover the essential steps and strategies for implementing Observability effectively, enabling organizations to gain deeper insights into system performance and behavior.
1. Instrumentation
Instrumentation involves embedding code within applications to collect the necessary data for observability. This includes strategically integrating libraries for metrics, strategically logging statements, and incorporating tracking mechanisms. Effective instrumentation lays the foundation for robust observability.
It also entails defining relevant metrics and key performance indicators (KPIs) that align with business objectives, ensuring that the collected data provides actionable insights into system health and performance.
2. Centralized Logging and Monitoring Systems
Organizations often invest in centralized logging and monitoring systems to harness the power of observability. These platforms aggregate data from various sources, providing a unified interface for analyzing metrics, logs, and traces. Prominent tools like Prometheus, Grafana, ELK stack, and Jaeger have become staples in the observability toolkit.
Leveraging these tools allows organizations to consolidate observability data, streamline analysis workflows, and gain actionable insights into system behavior, enabling proactive issue detection and resolution.
3. Collaboration and Culture
Observability is not just a set of tools; it’s a cultural mindset. Fostering collaboration among development, operations, and other relevant teams is essential. A culture that values transparency, information sharing, and continuous improvement is conducive to implementing and maximizing observability. This involves breaking down silos between teams, encouraging open communication, and promoting cross-functional collaboration on observability initiatives.
Additionally, organizations should invest in training and education programs to ensure team members have the necessary skills and knowledge to leverage observability tools and practices in their day-to-day activities effectively.
Observability Tools
Observability tools offer real-time visibility into system metrics and logs and facilitate proactive identification and resolution of issues before they impact end-users. By leveraging advanced analytics and machine learning algorithms, observability tools empower organizations to detect anomalies, optimize resource utilization, and enhance system resilience. Additionally, observability tools enable collaboration among development, operations, and other cross-functional teams, fostering a culture of continuous improvement and innovation.
1. Metrics Monitoring Tools
Metrics monitoring tools are instrumental in capturing and analyzing performance metrics and critical system health indicators. These tools collect data from different sources, such as servers, databases, and applications, and present it in a centralized dashboard for easy visualization and analysis.
Famous tools include Prometheus, Grafana, and Datadog, which offer robust capabilities for tracking and analyzing metrics in real-time.
2. Log Management Solutions
Log management solutions are essential for capturing and analyzing log data from applications and infrastructure components. These tools aggregate logs from multiple sources, such as servers, containers, and network devices, and provide powerful search and filtering capabilities for identifying and troubleshooting issues.
Elasticsearch, Logstash, and Kibana (ELK stack) are widely used log management solutions that offer scalable and flexible log aggregation, analysis, and visualization capabilities.
3. Distributed Tracing Platforms
Distributed tracing platforms enable organizations to trace the flow of requests across distributed systems and microservices architectures. These tools capture timing information and contextual metadata at each step of a request’s journey, allowing teams to identify performance bottlenecks, latency issues, and dependencies between services.
Popular distributed tracing platforms include Jaeger, Zipkin, and OpenTelemetry, which provide comprehensive tracing capabilities for understanding the end-to-end performance of distributed applications.
4. Synthetic Monitoring Services
Synthetic monitoring services simulate user interactions with applications and services to detect and address performance issues before they impact end-users proactively. These tools simulate user scenarios, such as page loads, form submissions, and API calls, and monitor critical endpoints’ response times and availability.
Synthetic monitoring services like Pingdom, Uptime Robot, and New Relic Synthetics offer comprehensive capabilities for monitoring application performance and uptime from different geographic locations.
5. Anomaly Detection Systems
Anomaly detection systems use machine learning algorithms to identify deviations from regular application and infrastructure metrics behavior. These tools analyze historical data patterns and automatically detect anomalies, such as spikes in CPU utilization, unusual network traffic patterns, or abnormal error rates. Anomaly detection systems help organizations proactively identify and address issues, minimize downtime, and optimize system performance.
Tools like Amazon CloudWatch Anomaly Detection, Datadog AI-powered anomaly detection, and InfluxDB anomaly detection offer advanced capabilities for detecting and alerting anomalies in real time.
Future Trends in Observability

As technology continues to evolve, so does the field of observability. Emerging trends indicate a shift towards more automation, artificial intelligence, and machine learning to derive meaningful insights from vast observability data. Integrating observability into DevOps practices and the evolution of standards and protocols will shape the future landscape of system observability.
1. Automation in Observability
Manual analysis and interpretation become increasingly challenging with the exponential data growth generated by modern software systems. Automation emerges as a critical trend in observability, leveraging machine learning algorithms and artificial intelligence (AI) to automate data collection, analysis, and response. By automating routine tasks and leveraging AI-driven anomaly detection, organizations can streamline operations, detect issues more quickly, and derive actionable insights from vast observability data.
2. Integration with DevOps Practices
Observability is increasingly integral to DevOps practices, bridging the gap between development and operations teams. By embedding observability into the software development lifecycle, organizations can ensure that observability considerations are built into applications from the outset. This integration facilitates continuous feedback loops, enabling teams to identify and address issues early in the development process, iterate rapidly, and deliver higher-quality software with improved reliability and performance.
3. Evolution of Standards and Protocols
As the field of observability matures, there is a growing emphasis on standardization and interoperability. Industry initiatives such as OpenTelemetry aim to establish common standards and protocols for observability, enabling seamless integration across disparate systems and platforms. Organizations can facilitate data exchange and interoperability between observability tools and platforms by adopting standardized data formats, protocols, and APIs. This empowers engineers to gain a unified view of system behavior regardless of the underlying technologies.
4. Real-time Monitoring and Alerting
With modern software systems’ increasing complexity and dynamism, real-time monitoring and alerting becomes paramount. Emerging trends in observability focus on enabling real-time visibility into system health and performance, coupled with intelligent alerting mechanisms that notify stakeholders of potential issues or anomalies as they occur. By providing timely and actionable insights, real-time monitoring and alerting help organizations proactively manage and mitigate risks, minimize downtime, and ensure optimal system performance.
5. Cloud-native Observability Solutions
As organizations increasingly embrace cloud-native architectures and microservices-based applications, observability solutions tailored to the cloud-native ecosystem are gaining traction. These solutions offer native integration with cloud platforms and container orchestration systems, providing visibility into distributed and ephemeral workloads. By leveraging cloud-native observability solutions, organizations can gain insights into the performance, scalability, and reliability of their cloud-native applications. This enables them to optimize resource utilization, troubleshoot issues, and ensure a seamless user experience.
6. Continuous Evolution and Innovation
Observability is a dynamic and evolving field driven by ongoing technological advancements and changing business requirements. As organizations continue to innovate and adopt new technologies, the landscape of observability will continue to evolve. Continuous investment in research and development, coupled with a commitment to embracing emerging trends and best practices, will be essential for organizations seeking to harness the full potential of observability to drive business success in an increasingly digital world.
Wrapping Up the Observability Journey
In the intricate tapestry of modern software systems, observability emerges as a guiding light, illuminating the path to efficient operations and continuous improvement. What is observability? It’s not merely a buzzword or a checklist item; it’s a holistic approach to understanding, managing, and optimizing complex systems. From metrics and logs to traces and beyond, observability empowers engineers to navigate the intricate labyrinth of software development with confidence and agility.
As we continue to push the boundaries of technological innovation, observability remains an indispensable ally, helping us unveil the mysteries of system behavior and ensuring the resilience of the digital ecosystems we build and maintain.
FAQs

1. What is observability in simple terms?
Just as simple as it sounds, observation means measuring the internal state of a process using a system’s outputs. A system may be viewed as “observable” only with input data, i.e., sensors.
2. What is observability in DevOps?
DevOps observability helps teams understand how systems work throughout the entire development phase. This helps improve customer experiences and reduces the time spent identifying defects and preventing them from happening in their systems.
3. How can I resolve system issues with Observability data?
Observabilities are crucial in SRE and DevOps since they ensure the reliable operation of the system. Observability is vital because it allows the user to get deeper insights about system behavior, allowing proactive monitoring of troubleshooters and improving system performance. For the developer, operational teams, or site reliability engineers, steps are required to detect, analyze, or resolve problems within any software system using observability data.
4. What is the role of real-user monitoring (RUM) and synthetic testing?
Moreover, organizations can use real-user monitoring in real time to gain real visibility of their user experience. Teams may monitor these experiences with synthetic monitoring or recording a particular event. This functionality extends Telemetry by including data on APIs and third-party services, errors that occur in the browsers, user demographics, and application performance from the user perspective.
5. How do I Implement Observability?
A combination of various tools, open-source software, and commercial solutions is essential to achieve Observable System Development. Implementing observability requires integrating four key components, each serving a distinct purpose in ensuring a comprehensive view of system behavior and performance. Metrics Monitoring, Log Management, Distributed Tracing, Anomaly Detection.