The Complete Guide to Full Stack Observability: Tools, Techniques, and Use Cases


Audio : Listen to This Blog.
In the fast-paced digital world, maintaining a seamless user experience is more critical than ever. Enter full stack observability—the superhero cape for IT operations and development teams providing complete visibility. Full stack observability gives you a 360-degree view of your systems, applications, and infrastructure, enabling alignment and collaboration between IT and business teams to detect anomalies and fix issues before they impact users.
Full stack observability also plays a crucial role in enhancing the overall customer experience by identifying and mitigating issues that may negatively impact it. This guide delves into the nuances of full stack observability, covering essential tools, cutting-edge techniques, and real-world use cases. Buckle up and get ready for a deep dive!
What is Full Stack Observability?
Source: Acceldata
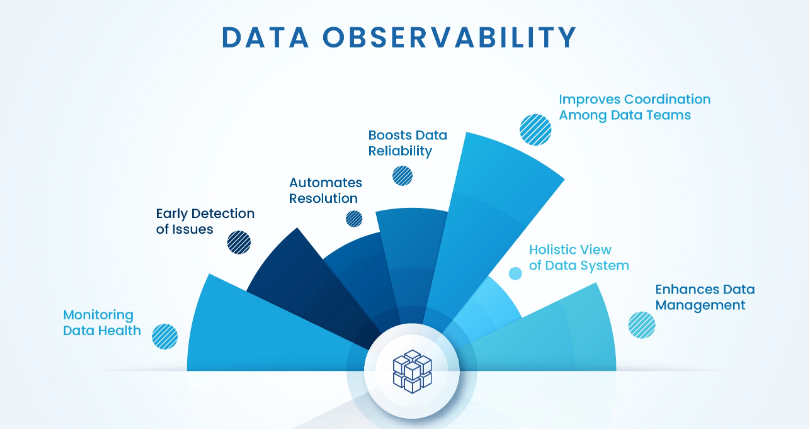
Full stack observability is the practice of monitoring and managing the performance of your entire technology stack—from the application layer down to the infrastructure. It’s like having X-ray vision for your tech environment. By providing comprehensive insights into every component of your entire stack, full stack observability helps you ensure optimal performance and quickly resolve issues.
Key Components of Full Stack Observability
Source; ManageEngine
In today’s digital landscape, ensuring optimal performance and reliability of IT environments is crucial for business success. Every organization should consider five critical aspects of monitoring: Application performance monitoring (APM), infrastructure monitoring, log management, user experience monitoring, and network monitoring.
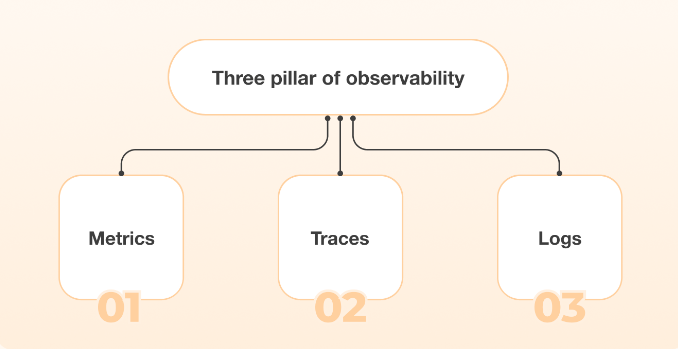
Telemetry data, which includes logs, metrics, and traces collected from various infrastructure and application layers, is crucial for achieving full stack observability.
Application Performance Monitoring (APM)
Application Performance Monitoring (APM) involves tracking the performance of software applications to ensure they function smoothly and efficiently. It helps identify issues such as slow response times, errors, and bottlenecks affecting user satisfaction and business outcomes. Organizations can often diagnose and resolve performance problems using APM tools before they impact end-users.
Additionally, digital experience monitoring focuses on improving customer experience by identifying and resolving issues related to application performance, such as page load times and latency.
Infrastructure Monitoring

Infrastructure Monitoring focuses on observing the health and performance of hardware components, servers, and virtual machines that support IT environments. It ensures that all infrastructure elements operate optimally and helps identify potential failures or resource constraints. Effective infrastructure monitoring maintains system uptime, optimizes resource utilization, and prevents downtime.
Additionally, cloud monitoring is essential for managing the performance of cloud-based applications and services.
Log Management
Log Management involves collecting, storing, and analyzing log data generated by various systems, applications, and devices within an IT environment. This data is invaluable for troubleshooting, security analysis, and compliance auditing. By leveraging log management tools, organizations can gain insights into operational issues, detect anomalies, and respond swiftly to security incidents.
User Experience Monitoring
User Experience Monitoring tracks how real users interact with applications and websites to ensure a seamless and satisfactory experience. It captures metrics such as load times, transaction success rates, and user journey mapping to highlight improvement areas. Understanding user behavior through this monitoring allows businesses to optimize their digital interfaces and enhance customer satisfaction.
Network Monitoring
Network Monitoring oversees a computer network’s status and performance to ensure availability and efficiency. It includes monitoring traffic and bandwidth usage and detecting connectivity issues or security threats. Proper network monitoring helps maintain robust performance, prevent outages, and secure the network against breaches.
Why is Full Stack Observability Important?
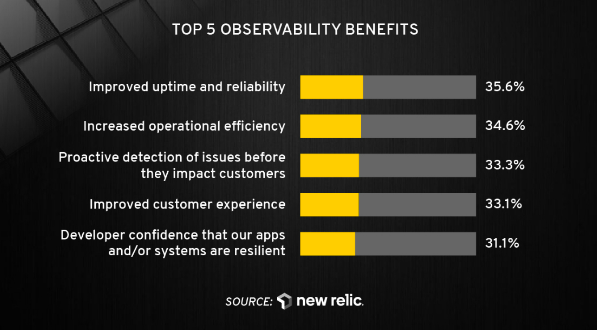
Source: New Relic
Modern applications are complex, often comprising microservices, distributed systems, and various third-party services. Traditional monitoring approaches fall short of providing cohesive insights across these components. IT teams are crucial in identifying and responding to evolving issues across the technology stack. Full stack observability offers:
Enhanced Troubleshooting: Enhanced troubleshooting allows organizations to pinpoint and resolve issues within their IT environment quickly. By using advanced monitoring tools, teams can detect anomalies and diagnose problems before they escalate. This proactive approach minimizes downtime and enhances overall system reliability.
Better User Experience: Maintaining a consistent and reliable service delivery is vital to ensuring a better user experience. Businesses can swiftly address issues by continuously monitoring user interactions and system performance. This commitment to high-quality service results in higher user satisfaction and loyalty.

Performance Optimization: Identifying bottlenecks and optimizing resource usage are crucial for maintaining peak performance in any IT system. Performance optimization tools help uncover inefficiencies and allocate resources more effectively. As a result, organizations can achieve faster response times, reduced costs, and improved operational efficiency.
Data-Driven Decisions: Leveraging insights from monitoring tools enables organizations to make data-driven decisions. These actionable insights guide strategic improvements and help prioritize projects that deliver the most value. Ultimately, this approach empowers businesses to stay competitive and adapt to changing market demands.
Core Tools for Full Stack Observability
Source: Expert Insights
Core tools for full stack observability are essential for a comprehensive view of an entire IT ecosystem, from frontend user interactions to backend infrastructure. These tools provide deep insights into application performance, network health, and user experience, enabling teams to detect and resolve issues more efficiently. A full stack observability solution uses telemetry data to gain insights into application, infrastructure, and UX performance.
By leveraging full stack observability, organizations can ensure optimal performance, enhance security, and deliver exceptional user experiences. Here’s a rundown of some essential ones:
Application Performance Monitoring (APM)
- New Relic: A comprehensive APM solution offering real-time insights into application performance, user interactions, and transaction traces.
- Datadog: Provides seamless integration with multiple platforms and in-depth application performance monitoring.
- AppDynamics: Offers end-to-end visibility into application performance with powerful analytics and diagnostic features.
Infrastructure Monitoring
- Prometheus: An open-source tool designed for monitoring and alerting, especially for complex, dynamic systems.
- Nagios: A veteran in the monitoring space, Nagios excels in monitoring servers, network devices, and applications.
- Zabbix: Another robust open-source solution, Zabbix provides extensive monitoring capabilities and customizability.
Log Management
- Splunk: A dominant player in log management, Splunk allows for comprehensive log analysis and correlation.
- ELK Stack (Elasticsearch, Logstash, Kibana): A versatile trio that enables powerful search, visualization, and analysis of log data.
- Graylog: An open-source alternative that offers scalable log management and analysis.
User Experience Monitoring
- Dynatrace: An AI-powered platform that monitors user experience across web, mobile, and IoT applications.
- Raygun: Specializes in accurate user monitoring and crash reporting, helping teams enhance user satisfaction.
- Google Analytics: While primarily a web analytics tool, it provides valuable insights into user behavior and interactions.
Network Monitoring
- SolarWinds Network Performance Monitor: Offers robust network monitoring capabilities, including automatic mapping and performance analysis.
- Wireshark: A popular open-source network protocol analyzer used for troubleshooting and analysis.
- PRTG Network Monitor: Provides comprehensive network monitoring with customizable dashboards and alerts.
Techniques for Effective Full Stack Observability
Mastering full stack observability goes beyond just using the right tools; it requires implementing best practices and techniques. Observability in cloud-native environments is crucial for effective full stack observability. Here are some to consider:
Distributed Tracing
Distributed tracing allows you to track requests as they flow through various services and components of your application. This technique is essential for identifying performance issues and bottlenecks in microservices architectures. Tools like Jaeger and Zipkin specialize in distributed tracing and can significantly enhance your observability efforts.
Anomaly Detection and Root Cause Analysis

Machine learning-powered anomaly detection helps you automatically identify deviations from normal behavior, such as sudden spikes in latency or resource usage. Integrating anomaly detection algorithms into your observability strategy can lead to proactive issue resolution.
Real-Time Dashboards

Real-time dashboards provide up-to-the-minute insights into your stack’s health and performance. Customizable dashboards, available in tools like Grafana and DataDog, enable teams to visualize key metrics and trends at a glance.
Automated Alerting

Automated alerting ensures that your team is immediately notified of critical issues, minimizing downtime and potential user impact. Configuring intelligent alerts based on thresholds and anomalies is crucial for maintaining system reliability.
Contextual Log Correlation for End-to-End Visibility
Contextual log correlation involves linking related log entries to view an event or incident comprehensively. This technique is invaluable for troubleshooting and root cause analysis. The ELK Stack and Splunk excel in log correlation capabilities.
Additionally, breaking down operational silos by fostering cross-functional collaboration and having a single source of truth can significantly enhance the effectiveness of contextual log correlation.
Real-World Use Cases of Full Stack Observability
E-Commerce Platforms
E-commerce businesses rely heavily on seamless user experiences and high availability. Full-stack observability helps these platforms monitor user interactions, transaction flows, and backend processes. By quickly identifying issues like slow page load times or failed transactions, companies can reduce cart abandonment and increase revenue.
Financial Services
Financial institutions require robust observability to ensure the security and performance of their systems. Full stack observability enables these organizations to monitor transaction integrity, detect fraudulent activities, and comply with regulatory requirements. Anomaly detection and real-time alerting play a pivotal role in safeguarding sensitive financial data.
Healthcare Systems
Healthcare providers depend on reliable and secure systems to manage patient information and deliver services. Full-stack observability ensures that electronic health records (EHR) systems, telehealth platforms, and other critical applications run smoothly. Healthcare organizations can mitigate risks and enhance patient care by monitoring performance and security metrics.
SaaS Applications
Software-as-a-service (SaaS) companies must deliver exceptional performance and uptime to retain customers. Full stack observability allows SaaS providers to monitor application performance, user engagement, and infrastructure health. Proactive issue resolution and data-driven optimizations result in improved customer satisfaction and retention.
Conclusion

In a world where digital experiences reign supreme, full stack observability is your trusty sidekick. It offers unparalleled insights into your applications and infrastructure, ensuring that you can anticipate issues, optimize performance, and deliver stellar user experiences. Whether you’re running an e-commerce platform, financial service, healthcare system, or SaaS application, embracing full stack observability is a game-changer.
By leveraging the right tools, techniques, and practices, you’ll be well-equipped to navigate the complexities of modern IT environments and stay ahead of the curve. So, put on your observability cape and take control of your tech stack like never before!