Icinga Eyes for Big Data Pipelines: Explained in Detailed

Audio : Listen to This Blog.
In the plethora of monitoring tools, ranging from open source to paid, it is always a difficult choice to decide which one to go for. This problem becomes more difficult when types of entities which are to be monitored are large and the ways of monitoring are diverse. The various possible entities which are monitored range from low level devices like switches, routers to physical and virtual machines to Citrix XenApp and XenDesktop environments. Some of the available ways of monitoring can be SNMP, JMX, SSH, Netflow, WMI and RRD metrics depending on the device which we want to keep an eye on.
With the “ * as code ” terminology coming into the software industry, people have started moving their deployments and configurations as code blocks which are easy to scale, flexible for changes and effortless to maintain. Infrastructure monitoring wasn’t able to keep itself unaffected from this paradigm and evolution of “Monitoring as a Code” came into existence. Icinga is one such tool.
Icinga was a fork of Nagios, which is a pioneer in network monitoring, but Icinga has diverged itself into Icinga2 and added various performance and clustering capabilities. Synchronizing with its name “Icinga”, which means ‘it looks for’ or ‘it examines’, is one of the best open source tools available for monitoring of wide variety of devices. Installation is pretty straightforward and requires installing icinga2 package on both master and clients.( yum install icinga2 )
All communications between Icinga2 master and clients are secure. On running the node wizard the CSR is generated and for auto signing it, a ticket is required which is obtained by running pki ticket command on client. Icinga Master setup will also require installing and configuring icingaweb2, which provides an appealing monitoring dashboard.
( icinga2 node wizard, icinga2 pki ticket –cn <icinga2-client-fqdn>)

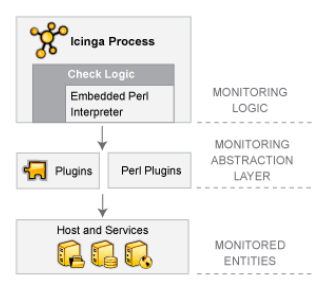
Figure 1: Pluggable Architecture
Monitoring tools like Icinga follow a pluggable architecture(Figure 1). The tool acts like a core framework in which plugins are glued for enhancing capabilities of core by expanding its functionalities. Installing a plugin for an application gives Icinga ability to monitor the metrics for that specific application. Because of this pluggable architecture, these tools are able to satisfy monitoring requirements of myriad of possible applications. For instance, Icinga have plugins for Graphite and Grafana for showing the graphs for various metrics. On the other hand, it also has integrations with Incident Management tools like OpsGenie and Pagerduty. Basic plugins for monitoring could be installed using:
yum install nagios-plugins-al
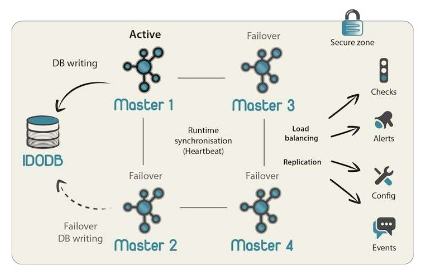
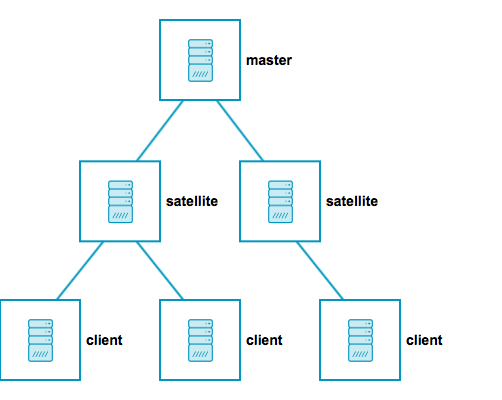
Icinga2 Distributed Monitoring in high availability clustered arrangement can be visualized from Figure 2. Clients run their preconfigured checks or get commands execution events from master/satellite. Master is at core of monitoring and provides icingaweb2 UI. Satellite is similar to master and can run even if master is down and can update master when it is available again. This prevents monitoring outage for entire infrastructure in case of unavailability of master temporarily.


Figure 2: Icinga2 Distributed Monitoring with HA
Typical big data pipeline consists of data producers, messaging systems, analyzers, storage and user interface.

Figure 3: Typical Big Data Pipeline
Monitoring any big data pipeline can be bifurcated mainly into two fields: system metrics and application metrics where metrics is nothing but any entity which varies over time. System metrics comprises of information about CPU, disk and memory i.e. health of a host on which one of the Big Data element is running. Whereas application metrics dives into specific parameters of an application which helps in weighing its performance. Most of the applications can be monitored remotely as they are reachable over REST or JMX. These applications need not install Icinga client for monitoring application metrics. But for system metrics and monitoring those application which do not fall in JMX/REST category, client installation is required.
Everything is an object in Icinga; be it a command, a host or a service. Kafka and Spark expose JMX metrics. They can be monitored, using check_jmx command. Let’s consider an example of monitoring a spark metric. The configurations would look like this.
object Host "spark" {
  import "generic-host"
  address = "A.B.C.D"
}
object CheckCommand "check_jmx" {
  import "plugin-check-command"
  command = [ PluginDir + "/check_jmx" ]
  arguments = {
    "-U" = "$service_url$"
    "-O" = "$object_name$"
    "-A" = "$attrib_name$"
    "-K" = "$comp_key$"
    "-w" = "$warn$"
    "-c" = "$crit$"
    "-o" = "$operat_name$"
    "--username" = "$username$"
    "--password" = "$password$"
    "-u" = "$unit$"
    "-v" = "$verbose$"
  }
}
apply Service "spark_alive_workers" {
  import "generic-service"
  check_command = "check_jmx"
  vars.service_url = "service:jmx:rmi:///jndi/rmi://" + host.address + ":10105/jmxrmi"
  vars.object_name = "metrics:name=master.aliveWorkers"
  vars.attrib_name = "Value"’
  assign where host.address
}
The Icinga folder hierarchy inside parent directory is not specific (/etc/icinga2/conf.d) and could be steered according to our requirements and convenience. But all *.conf files are read and processed. Elasticsearch gives REST access. Adding objects and services similar to the above example and changing the command to check_http (and related changes), we will be able to monitor ES cluster’s health. The command which will be fired at every tuned interval will look something like this.
check_http -H A.B.C.D -u /_cluster/health -p 9200 -w 2 -c 3 -s green
Similarly, Icinga/ Nagios plugins are available for various NoSQL databases (MongoDB).
These configurations look very daunting and they become more threatening when one has to deal with large number of hosts that are also running variety of applications. That’s where Icinga2 Director comes handy. It provides an abstraction layer in which creating templates for commands, services and hosts are possible from UI and then those templates could be applied to hosts easily. In the absence of Director, configurations need to be manually done on each client which is to be monitored. Director offers a top down approach, i.e. by changing service template for a new service and just clicking deploy configuration, it enables new service at all hosts without incurring the trouble of going to every node.

2 Comments
Good Article… Is there any thoughts around integrating the performance monitoring tools along with Inventory Management, Provisioning & configuration management ??
Thanks for reading. Apart from performanace monitoring(https://www.icinga.com/2012/12/07/addons-for-icinga-performance-monitoring-tools/) Icinga2 provides Icinga Director having ability to keep all the configurations at common place and push to all nodes. (https://www.icinga.com/2016/03/24/icinga-director-released/). I doubt in current release provisioning would be possible.
Having pluggable architecture, inventory management could be integrated with plugins(https://exchange.nagios.org/directory/Plugins/Inventory-Management)