Comprehensive Observability Solutions: From Implementation to Optimization

Audio : Listen to This Blog.
Observability is a term that raises many eyebrows. Before you hit the back button, let’s clarify: observability is way cooler than it sounds. Think of it as the Tony Stark of IT infrastructure—always watching, constantly aware. We all want our systems to work seamlessly, whether you’re managing a gargantuan enterprise network or a scrappy startup’s cloud environment.
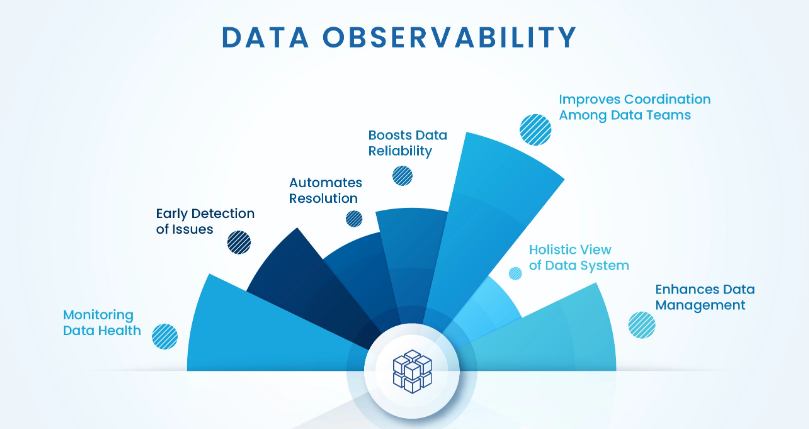
We’re about to embark on a journey through the nitty-gritty of observability solutions—from implementation to optimization. We’ll explore how an observability platform integrates various tools and capabilities to provide a holistic view of system health and performance. These platforms consolidate data from multiple sources, offering complete visibility into each layer of a distributed environment and delivering real-time insights into applications and infrastructure.
Source: Acceldata
What is Observability?
Let’s start with the basics: Observability isn’t just another buzzword by tech-savvy folks. It’s a critical concept that refers to the ability to measure a system’s internal state by examining its outputs. This involves collecting telemetry data such as logs, metrics, and traces—collectively known as the “three pillars” of observability.
The Three Pillars of Observability
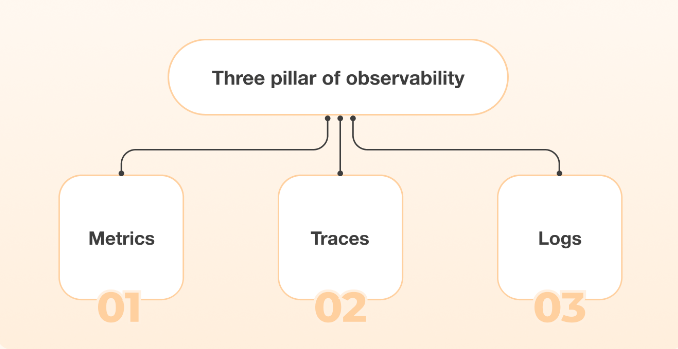
Logs, metrics, and traces provide unique insights that help diagnose issues and maintain optimal system performance. Metrics offer quantitative performance data points that measure specific aspects of system performance over time. Below, we delve into these elements to highlight their distinct roles and benefits.
1. Logs: Logs provide a detailed account of discrete events within a system. They are your go-to when something goes wrong, and you need to understand what happens at a granular level. With logs, you can trace the sequence of events and pinpoint where issues may have occurred.
2. Metrics: Metrics offer quantitative data points that measure specific aspects of system performance over time. Think CPU usage, memory consumption, and request rates. These measurements help you monitor system health and identify trends that could signal potential problems.
3. Traces: Traces follow a request as it moves through various services in a distributed system, offering a high-level view of how different components interact. This end-to-end tracking helps you see where delays or failures occur, facilitating faster problem resolution. Traces are invaluable for understanding complex dependencies within your system.
Implementing Observability Solutions
Identify the key metrics, logs, and traces critical for monitoring application performance. Establish clear objectives for what you aim to achieve with observability (e.g., reducing downtime, improving performance, detecting anomalies). Understanding your goals helps focus efforts on areas that provide the most value and ensures alignment with business needs.
Select Appropriate Tools and Platforms
Research and choose observability tools that best meet your requirements, such as Prometheus for metrics, ELK Stack for logging, and OpenTelemetry for tracing. Ensure the chosen tools integrate seamlessly with your existing infrastructure and support scalability. The right tools are crucial for data collection, visualization, and analysis.
Instrument Your Application
Add instrumentation to your codebase to collect relevant metrics, logs, and traces. This usually involves using SDKs or APIs provided by your observability tools. Ensure comprehensive coverage by instrumenting all critical components of your application. Proper instrumentation is the backbone of an effective observability strategy, providing the data needed for insights.
Set Up Data Collection and Storage
Configure data collection pipelines to gather metrics, logs, and traces from your application and infrastructure, which is essential for managing the data generated by IT systems. Set up storage solutions to handle the collected data efficiently. Use scalable and cost-effective storage options to manage large volumes of data. Efficient data collection and storage ensure you can retain and access the information necessary for ongoing analysis and troubleshooting.
Implement Dashboards and Alerts

Create dashboards on a centralized platform that visualizes key metrics, logs, and traces, making it easier to monitor your system’s health and performance. Set up alerts to notify you of potential issues in real time. Define alert thresholds based on historical data and business requirements. Dashboards and alerts provide immediate visibility into system status and enable quick response to emerging problems.
Integrate with Incident Management Systems
Connect your observability tools with incident management platforms like PagerDuty or Opsgenie to streamline the response process. Establish clear protocols for incident escalation and resolution based on the alerts generated by your observability tools. Integration with incident management systems facilitates efficient issue handling, minimizing downtime and impact.
Perform Regular Reviews and Refinements
Continuously review the effectiveness of your observability setup. Analyze the data and insights gathered to identify areas for improvement. Adjust your instrumentation, dashboards, and alert configurations to adapt to changing requirements and evolving systems. Regular reviews ensure that your observability solutions remain relevant and practical.
Train Your Team

Conduct training sessions to ensure your team understands how to use the observability tools and interpret the collected data. Encourage continuous learning and improvement, where team members share insights and best practices regularly. Well-trained teams are essential for maximizing the benefits of observability tools and maintaining system reliability.
Leverage Advanced Analytics and Machine Learning
Implement advanced analytics and machine learning models to enhance anomaly detection and predictive maintenance capabilities. These technologies can help you gain deeper insights into system behavior and preemptively address potential issues. They can also significantly improve the accuracy and efficiency of your observability efforts.
Document and Share Best Practices
To build a knowledge repository, document your observability processes, configurations, and lessons learned. Share best practices across teams to promote consistency and reliability in implementing observability solutions. Documentation helps ensure that valuable knowledge is preserved and accessible, fostering an environment of continuous improvement.
Okay, so you’re convinced that observability is essential. But how do you implement it? I’m glad you asked!
Choosing the Right Tools
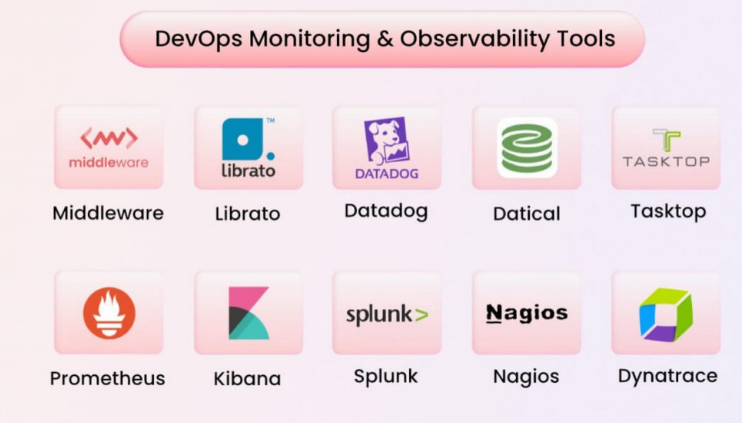
There are countless tools out there, each with its strengths and weaknesses. Selecting the right tool can significantly enhance your ability to monitor, diagnose, and optimize system performance. Here are a few heavyweights in the field:
Prometheus is an open-source monitoring and alerting toolkit designed for reliability and scalability. It excels at collecting and storing metrics, making it an ideal choice for tracking performance indicators such as CPU usage, memory consumption, and request rates. One of its standout features is the powerful querying language PromQL, which allows users to slice and dice time-series data in real time. Additionally, Prometheus supports a variety of integrations and exporters, enabling seamless data collection from diverse sources.
The ELK Stack, consisting of Elasticsearch, Logstash, and Kibana, is perfect for centralized logging. Elasticsearch provides a robust search engine that can quickly index and query large volumes of log data. Logstash acts as the data processing pipeline, ingesting logs from various sources and transforming them before sending them to Elasticsearch.
Kibana, the visualization tool, allows users to create interactive dashboards and gain insights into their log data. Together, these components form a robust ecosystem for managing and analyzing logs, helping teams troubleshoot issues, and maintaining system health.
Jaeger is an open-source, end-to-end distributed tracing tool that monitors complex, microservice-based architectures. It tracks the flow of requests through different services, providing a high-level view of how components interact. Jaeger’s capabilities include root cause analysis, performance optimization, and monitoring service dependencies. By visualizing traces, developers can quickly identify bottlenecks, latency issues, and failure points within the system, leading to faster resolution of problems and more efficient service operations.
Setting Up Your Monitoring Stack for Infrastructure Monitoring
Observability enables you to monitor application and infrastructure components effectively, ensuring better reliability and user experience. Here are essential steps to integrate logging, capture metrics, and enable tracing in your system.
Integrate Logging
Start with an ELK stack for comprehensive log management. The ELK stack, which includes Elasticsearch, Logstash, and Kibana, offers a powerful solution for collecting, parsing, and visualizing logs from various sources. Centralize logs from all your systems to make querying and analysis more manageable, providing a single pane of glass for all your log data. Implementing the ELK stack helps proactively identify issues, understand system behavior, and facilitate root-cause analysis.
Capture Metrics

Deploy Prometheus to capture and store metrics. Prometheus is a flexible monitoring solution that can collect metrics from various sources, including application instrumentation and infrastructure components. Set up Grafana for beautiful dashboards that visualize your data. These dashboards allow you to monitor key performance indicators, track trends over time, and quickly identify anomalies. Prometheus and Grafana provide a powerful combination for real-time monitoring and alerting.
Enable Tracing
Use Jaeger to capture traces across your microservices architecture, giving insights into request flow and latency. Jaeger is designed to monitor and troubleshoot transactions in complex distributed systems, making it easier to pinpoint bottlenecks and optimize performance. By enabling tracing, you gain a deeper understanding of how requests propagate through your services, essential for diagnosing issues and improving overall system efficiency.
Configuring Alerts
Implementing observability without alerts is like using traditional monitoring tools that lack proactive capabilities. Use Alertmanager with Prometheus to set up actionable alerts. Make sure these alerts are well-defined to avoid alert fatigue.
Optimizing Observability Solutions
Once you’ve implemented your observability solution, it’s time to optimize it. Optimization ensures that your observability framework remains effective as your system scales.
Fine-Tuning Metrics Collection

Collecting too many metrics can be overwhelming and costly. Focus on the ones that matter most for your specific use case. Prioritize key performance indicators (KPIs) that align closely with your business objectives. This makes it easier to derive actionable insights without getting bogged down in data noise. Use labels wisely to add context to your metrics, but avoid over-labeling, which can lead to cardinality issues. Dynamic thresholds and anomaly detection can refine your metrics collection by focusing on significant deviations rather than normal fluctuations.
Log Management, Aggregation, and Query Optimization

Centralized logging is excellent but can become a bottleneck if not managed well. Index patterns in Elasticsearch can be used to optimize search queries, drastically improving query performance. Regularly prune old logs to manage storage costs and ensure efficient log searching.
Consider tiered storage options to move less frequently accessed logs to cheaper storage solutions. Additionally, rate limiting and logging levels should be implemented to control the volume of logs generated, ensuring that only essential information is captured and stored.
Trace Sampling
Capturing 100% of traces might sound ideal, but it’s usually unnecessary and resource-intensive. Implement trace sampling to capture a representative subset of traces. This will reduce overhead without sacrificing the quality of insights. Use adaptive sampling techniques to ensure that you still capture traces from critical paths and high-priority transactions.
Focusing on a smaller, more relevant data set can help your tracing system maintain high performance while gaining valuable insights into application behavior. Furthermore, integrating trace data with your metrics and logs can provide a more comprehensive view of your system’s performance and help resolve issues faster.
Advanced Observability Techniques
As you become more comfortable with the basics, you can explore the advanced techniques offered by modern observability tools for deeper insights.
Machine Learning for Anomaly Detection
Leverage machine learning algorithms to detect anomalies in real time. Traditional monitoring systems rely on predefined thresholds, which can miss subtle issues or generate false alarms for normal variations. Machine learning models, however, can learn from historical data to identify unusual patterns or deviations from the norm. Tools like Elastic APM and Prometheus have built-in capabilities for anomaly detection, helping you identify issues before they escalate.
These tools can automatically adjust to changing conditions and be fine-tuned to recognize specific anomalies relevant to your application. Additionally, integrating anomaly detection with alerting systems ensures that you receive timely notifications about potential issues, allowing for faster resolution and minimizing downtime.
Distributed Tracing with OpenTelemetry
OpenTelemetry is an open-source observability framework that provides APIs and instrumentation for collecting traces and metrics. Unlike traditional tracing tools, OpenTelemetry supports multiple backends, making switching or integrating new observability platforms easier. This flexibility allows you to start with one backend and move to another as your needs evolve without significant rework. OpenTelemetry supports various programming languages and frameworks, enabling comprehensive visibility across different parts of your stack.
By capturing end-to-end transaction data, OpenTelemetry helps you understand how requests propagate through your system, identify performance bottlenecks, and trace errors to their source. It also facilitates the correlation of metrics, logs, and traces, providing a holistic view of your application’s health and performance. Integrating OpenTelemetry into your observability strategy can lead to more efficient troubleshooting, improved performance tuning, and better system reliability.
Real-World Use Cases
No article on observability solutions would be complete without some real-world examples. Let’s explore how companies are using observability to their advantage.
E-commerce Platforms
E-commerce giants like Amazon and eBay rely heavily on observability to maintain uptime and ensure a flawless user experience. These platforms use real user monitoring to enhance customer experiences and identify and fix customer-facing issues with complete visibility into the end-user experience across web and mobile platforms. They handle millions of daily transactions; even minor issues can lead to significant revenue loss and customer dissatisfaction. Distributed tracing helps them monitor complex workflows, from browsing products to checkout, catching any hiccups. By tracing each request through multiple services and components, engineers can quickly pinpoint performance bottlenecks, identify failed transactions, and optimize resource utilization.
Real-time metrics and logs provide immediate insight into system health, allowing for proactive maintenance and rapid incident response. Additionally, anomaly detection algorithms flag unusual patterns in traffic or error rates, enabling early intervention before issues escalate. This comprehensive observability framework ensures that e-commerce platforms remain resilient, scalable, and user-friendly, maintaining customer trust and driving continuous growth.
Financial Services
Banks and financial institutions use observability to meet stringent compliance requirements and ensure transaction integrity. The financial sector is highly regulated, with strict guidelines around data security, transaction monitoring, and audit trails. Real-time monitoring and log analysis are crucial for promptly detecting fraudulent activities and system breaches. Financial institutions can proactively identify and resolve performance issues by leveraging advanced observability tools, including synthetic monitoring, ensuring transaction integrity and seamless operations.
Machine learning models enhance this by analyzing historical data to detect anomalies indicative of fraud or other security threats. Moreover, comprehensive logging and monitoring support robust audit trails, making it easier to comply with regulatory requirements and conduct thorough investigations when needed. This multi-faceted approach to observability safeguards financial assets and reinforces customer confidence in the institution’s ability to protect their sensitive information.
Best Practices for Observability
To wrap things up, here are some best practices to remember as you implement and optimize your observability solution.
Consistent Naming Conventions
Consistency is vital in making your observability data useful. Stick to naming conventions for your logs, metrics, and traces to ensure everything is easily searchable and understandable. A consistent naming scheme helps avoid confusion and makes it easier for team members to locate and analyze the necessary data. It also simplifies the creation of queries, dashboards, and alerts, enhancing overall efficiency and accuracy.
Regular Audits
Conduct regular audits of your observability setup. Audits help verify that your tools capture the correct data and that your alerts remain relevant to current operational conditions. Regular reviews can identify gaps in monitoring, outdated metrics, or areas where performance has degraded. This proactive approach ensures you stay ahead of potential issues, maintaining system reliability and performance.
Invest in Training
Your observability tools are only as good as the people using them. Invest in training your team to understand and maximize your observability stack. Comprehensive training programs can bridge knowledge gaps, enabling your team to effectively leverage your tools’ advanced features. Skilled users are better equipped to interpret data, troubleshoot issues, and optimize system performance, leading to a more resilient infrastructure.
Conclusion

So there you have it, a comprehensive guide to observability solutions—from implementation to optimization. Just remember, observability isn’t a one-time project but an ongoing effort. Stay vigilant, continually refine your setup, and soon enough, you’ll have a robust system that tells you when and why things go wrong.
Got questions or need further insights? Feel free to reach out. Let’s make your systems as observable as Tony Stark’s Iron Man suit—minus the snarky AI. Have you already started implementing observability solutions in your organization?